Today we are releasing the new and improved version of Data Centers & Power, our live research and data product tracking 382GW of data center capacity.
Data Centers & Power shows you how each project intends to get power, who is contracted to supply it, and whether steel is actually in the ground.
That means you can tell the difference between speculative announced capacity and the projects that are likely to materialize.
Hyperscalers use it to screen sites by realistic time-to-power. Utilities use it to test how much announced load in their territory is real. Developers use it to benchmark powering strategy and spot contention for megawatts. Investors and lenders use it to assess credible opportunities and risk exposure. OEMs and EPCs use it to find unsupplied projects to sell into.
"The data center buildout is forcing energy players to move faster than legacy research tools can support," said Kim Zou, co-founder and CEO of Currence. "We built Data Centers & Power to give them bottoms-up, project-level visibility on the power, supply, and policy that are driving the AI buildout, instead of another static report."
Follow the power
With the new data and tooling you can understand:
How data centers plan to get power. Whether its grid connected, behind-the-meter or hybrid. Plus information on the serving utility, balancing authority, and ISO or RTO where applicable.
Who is supplying the power. Power and offtake contracts for more than 700 data center projects.
What generation sits behind it. Roughly 30,000 US power projects, alongside investor-owned utilities, all 31 balancing authorities, and the major munis and co-ops.
Whether the whole thing holds up. A credibility score built from eight factors, including power supply arrangements, powering plan, and estimated time to power, updating live as new data lands.
Follow the delays
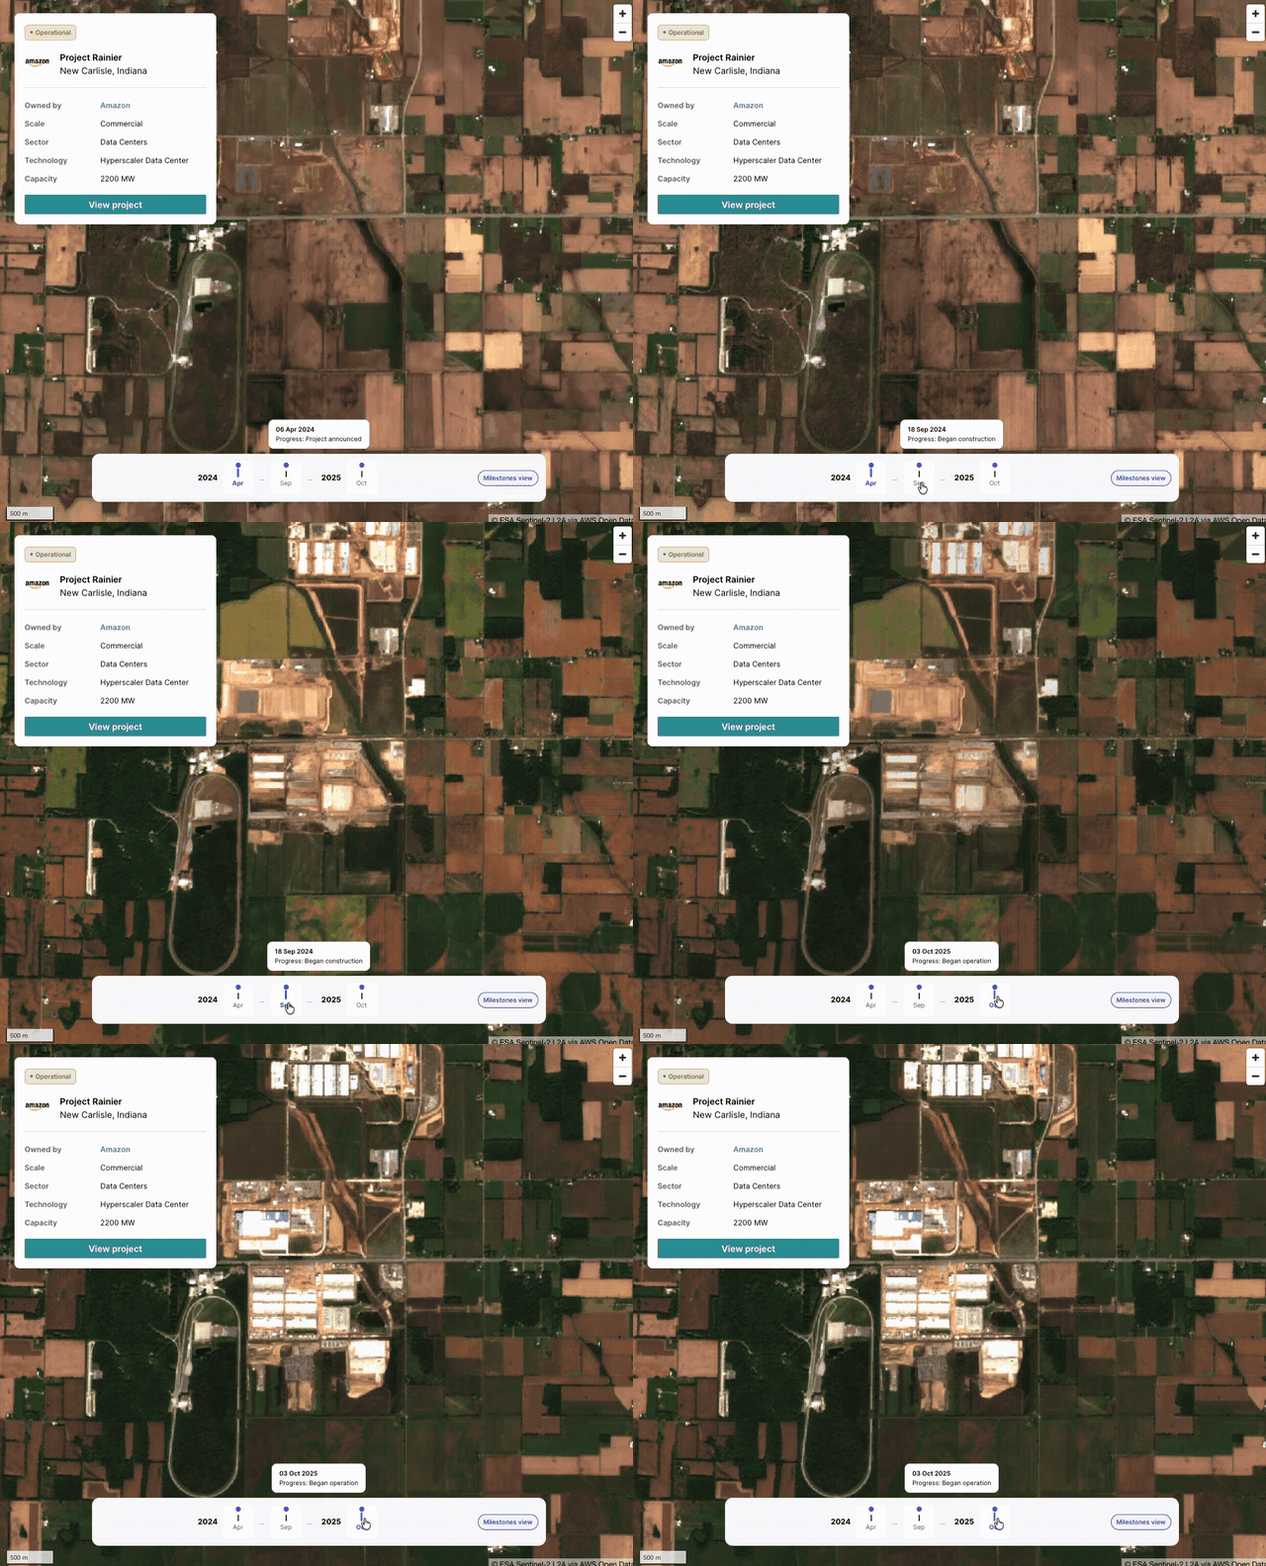
Delays are announced late, if at all. Satellite imagery provides ground truth into project credibility. Without it, you’re left guessing at what's real. Every project with a confirmed address now has satellite imagery tracked over time, and you can watch a site move from announced, to under construction, to operational. Or you can see and get alerted if a delayed site doesn’t move at all.
Follow the moratoria
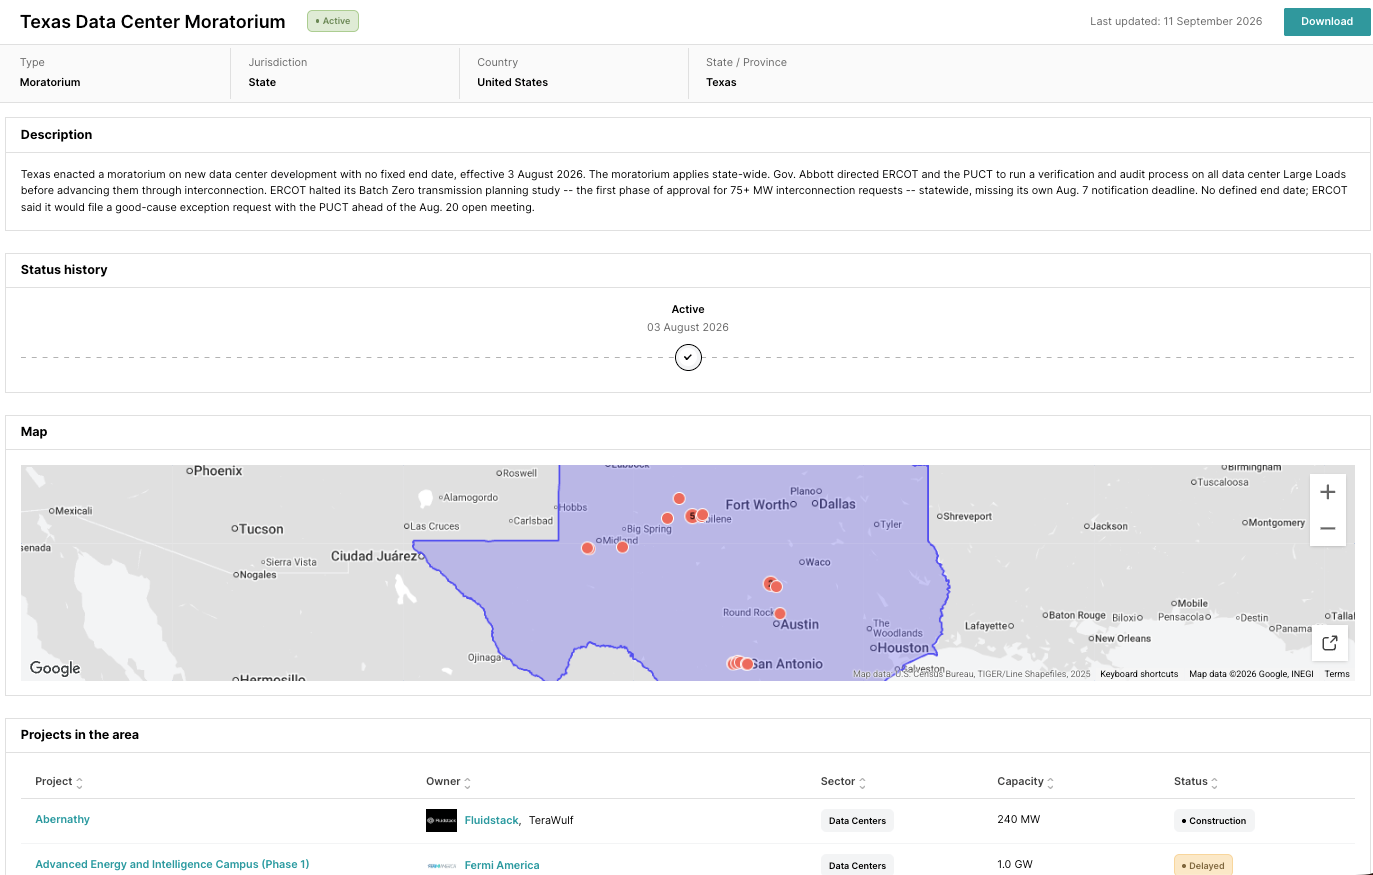
We’ve tracked over 400 data center moratoriums that have been announced across US counties and states and the rise of the moratorium is now stalling projects.
They are spreading faster than most site selection processes track. You can now check projects that are exposed when a restriction lands, see which jurisdictions have restrictions and of what type, and steer new sites away from markets where the politics have turned.
Follow the large load tariffs
Utilities are filing tariffs built specifically for large loads, and state regulators are approving them with terms that differ by state and by utility. The terms are public but buried in dockets.
We track over 100 tariffs across every filing through regulatory review, the load threshold, and - most importantly match it to the projects that meet the criteria in that service territory - so you can quickly assess what power will cost under the tariff that applies to it.
New tools, more data
New tools
- Satellite imagery: Satellite imagery provides ground truth into project credibility. Without it, clients are left guessing at what's real. Every project with a confirmed address now has imagery tracked over time, and you can watch a site move from announced, to under construction, to operational.
- Moratorium tracker: The power bottleneck and equipment lead times cause delays, but it's moratoria and community opposition that kill them outright. We built a comprehensive database of these moratoria, their status and coverage area, as well as data center projects within the impacted area.
- Large load tariff tracker: Utilities are filing tariffs built specifically for large loads like data centers, and state regulators are reviewing and approving them with terms that differ by state and by utility. We track every filing as it moves through regulatory review, capturing rate structures, minimum load requirements, and collateral terms.
More data
- Credibility scores now update live as new data lands.
- Powering models, grid, on-site, and hybrid, across more than a thousand projects.
- Power supply layer now includes US investor-owned utilities, all 31 balancing authorities, the major munis and co-ops, and roughly 30,000 US power projects.
- Power and offtake contracts for more than 700 data center projects.
- US coverage now includes IT capacity, PUE, redundancy tier, rack density, street address, acreage, facility size, related utility and grid operator.
- Signals and status tracking now match news and evidence events automatically to the projects they affect, with status changes tracked alongside the stated reason behind them.
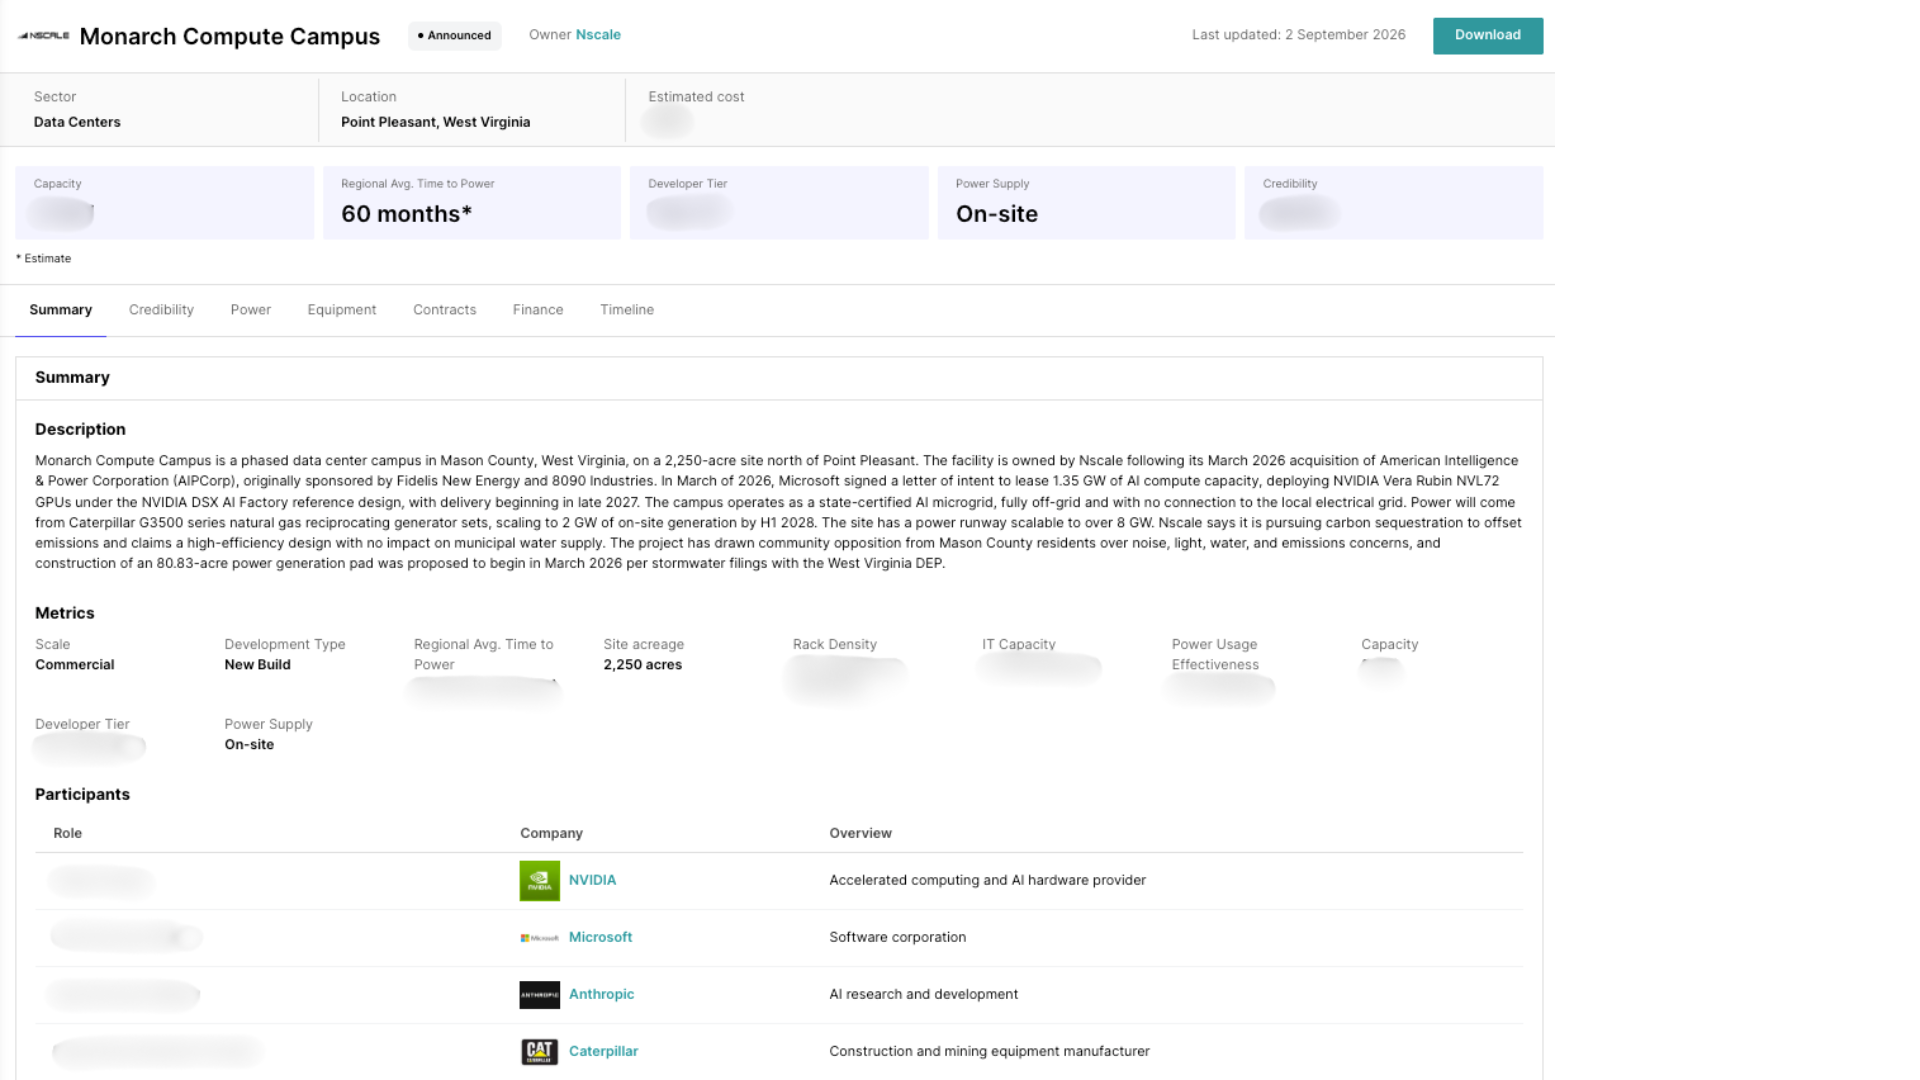
Data Centers & Power combines the speed of AI with the trust of expert research, delivered directly into your workflows via API, MCP, or through our platform. The product covers projects over 50MW announced since 2024, the segment of the market most consequential to its scale and most active today.
Download the Q3 Data Center Outlook to see our latest research on how component inflation is driving hyperscaler capex.
About Currence
Currence is an AI-native market intelligence company for the teams that finance and build the energy system. Its coverage spans the energy and AI buildout, from the power behind data centers to grids, fuels, and frontier technologies.
More than 90 teams already run on the Currence engine, including Microsoft, bp, Baker Hughes, Southern Company, HSBC, BBVA, Siemens Energy, Shell, BHP, B Capital, Galvanize, and Mitsui.
Book a demo with our team to learn more.