Compass

The innovator’s radar for energy and climate tech

Companies, deals, investors, technologies, and sector landscapes across energy, industrials, robotics, and climate.

Get the data
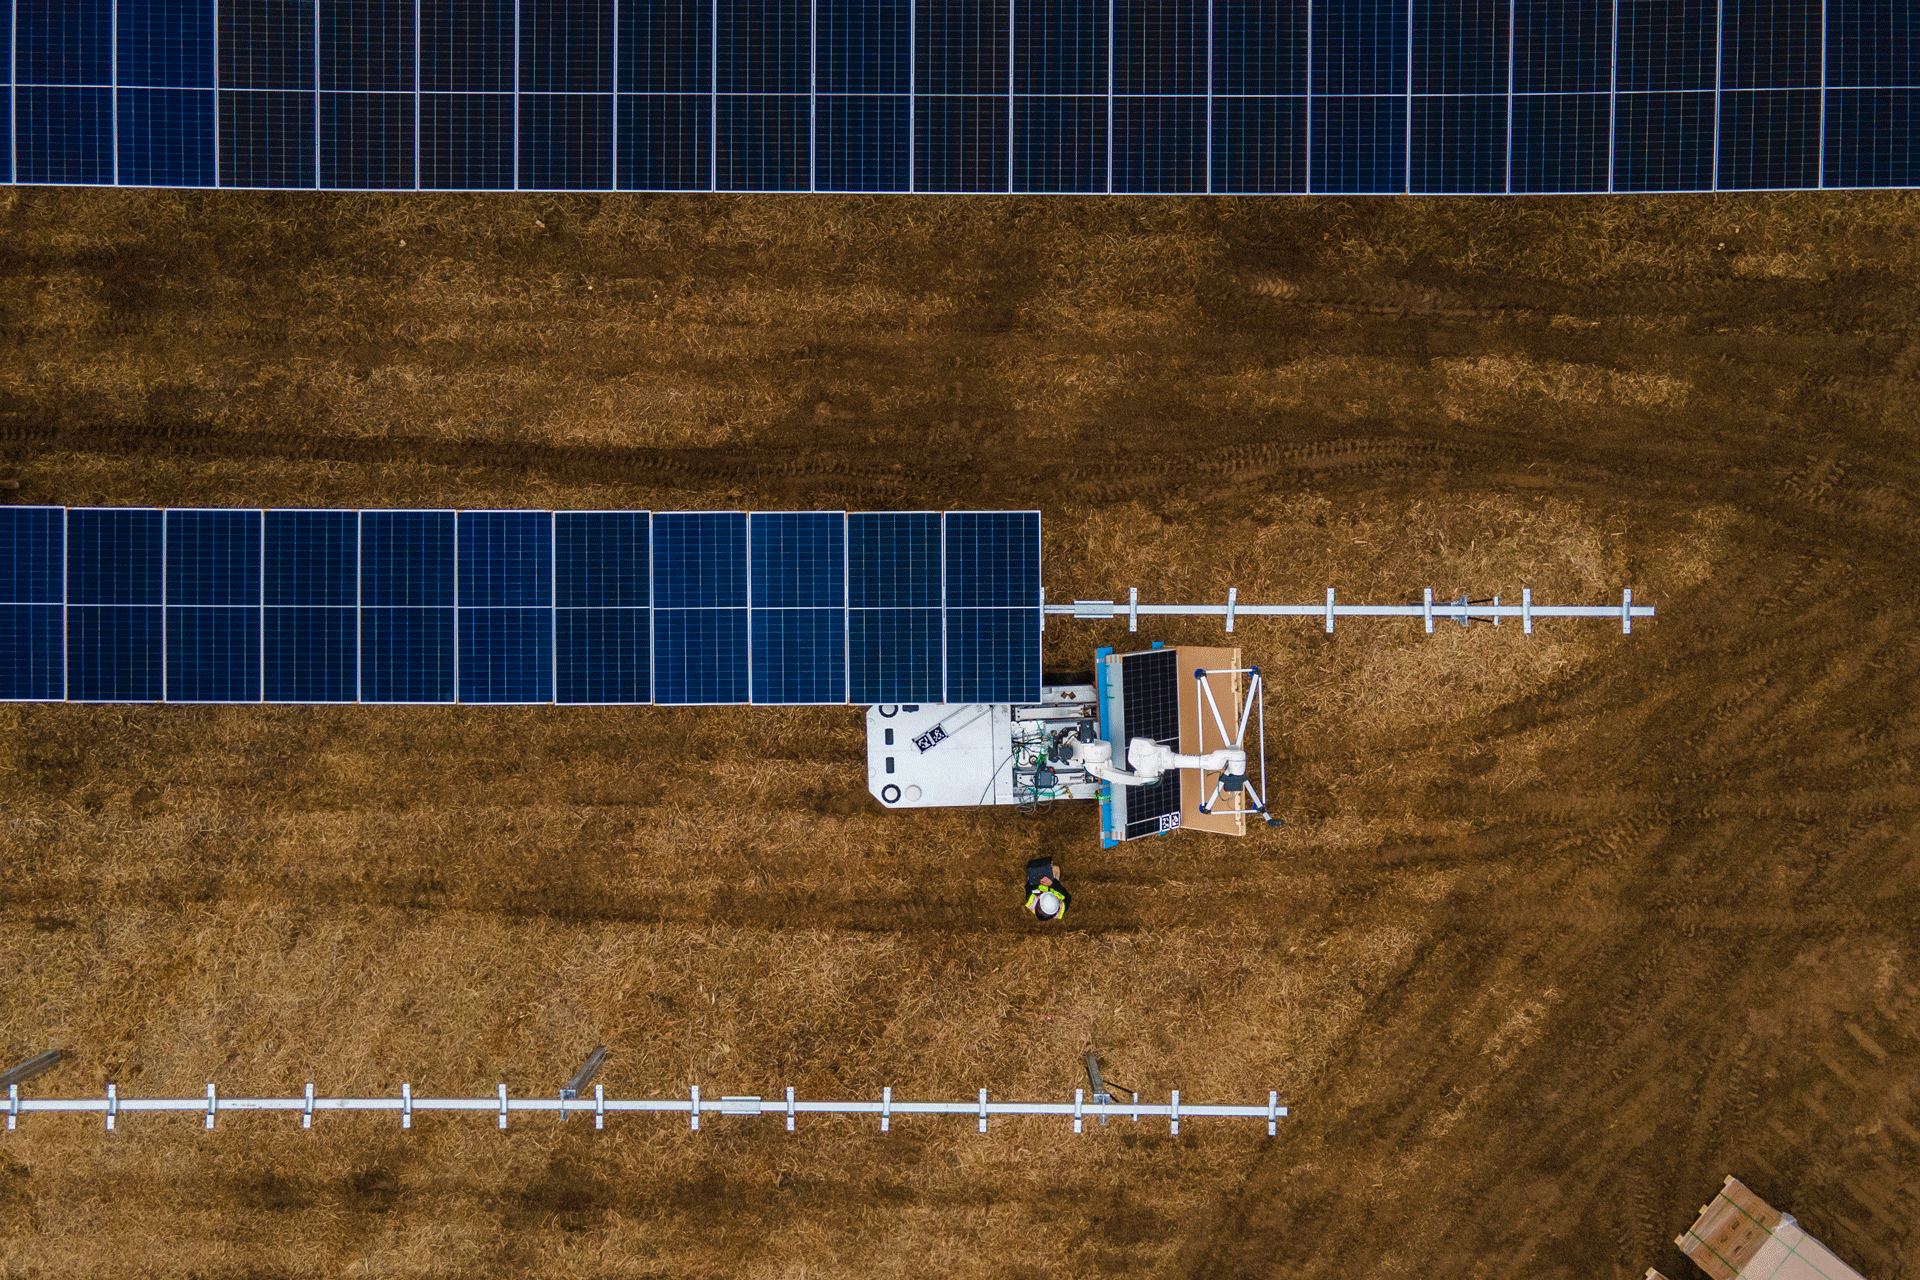
Aerial view of a solar panel installation with two rows of solar panels and a robotic arm machine in between, on dry brown grass.
Shortlist the leading tech and companies
60,000+
Companies
40,000+
Transactions
800+
Technologies
Our customers
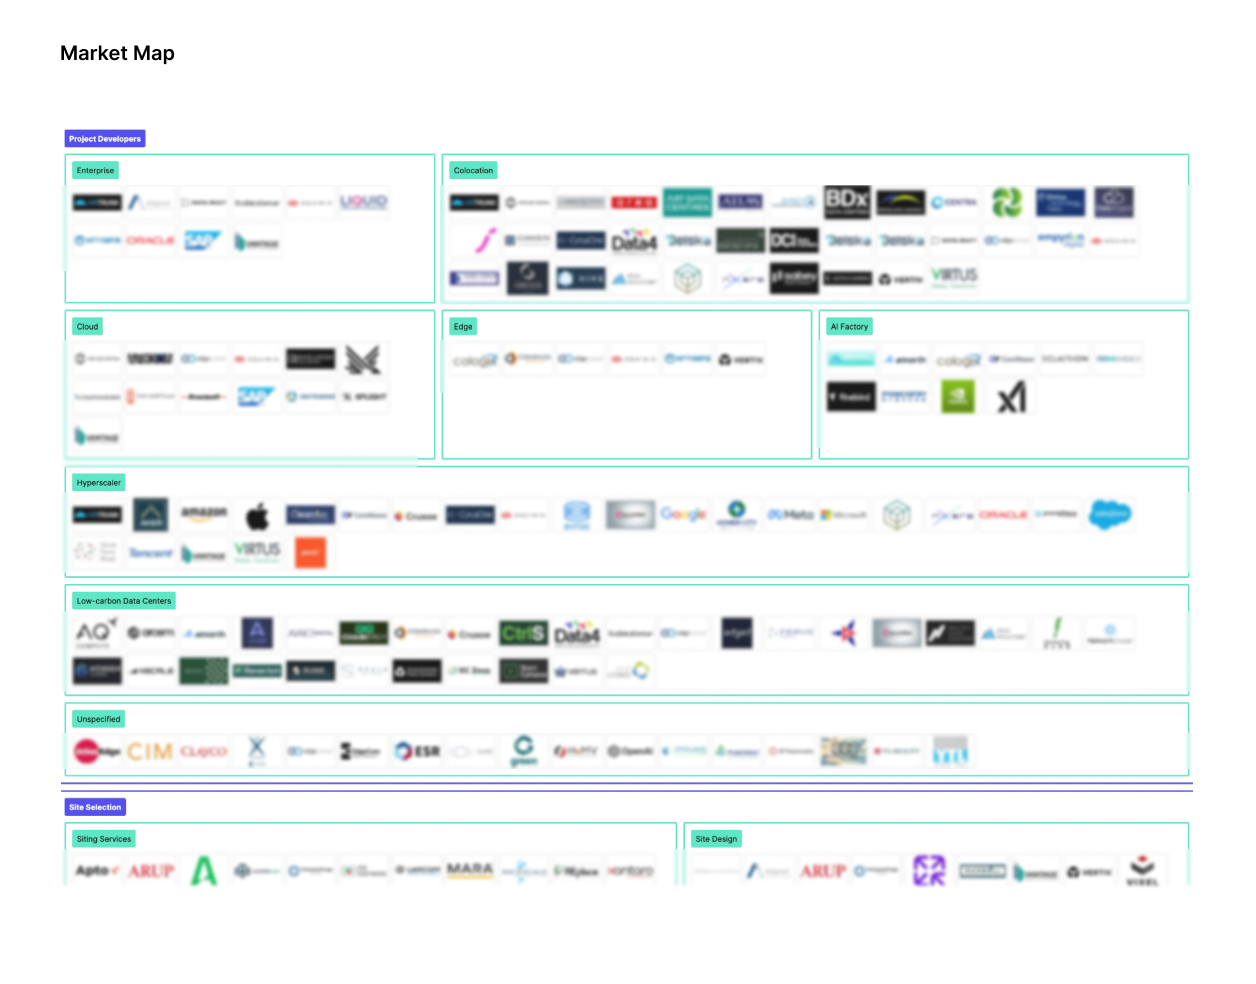
Map the market and assess commercialization readiness
KPIs, value chains, market maps, and the activity signals indicating where the market goes next.
Landscape any sector across our 800+ sector taxonomy and see where key players sit across the value chain
Know where commercial-scale deployment is happening drawn from 40,000+ tracked projects
Spot the inflection by monitoring company moves, capital flows, and over 6,000 other signals a week
Market map infographic displaying logos of companies categorized under Project Developers with subcategories Enterprise, Colocation, Cloud, Edge, AI Factory, Hyperscaler, Low-carbon Data Centers, and Unspecified, and under Site Selection with subcategories Siting Services and Site Design, each showing multiple company logos.
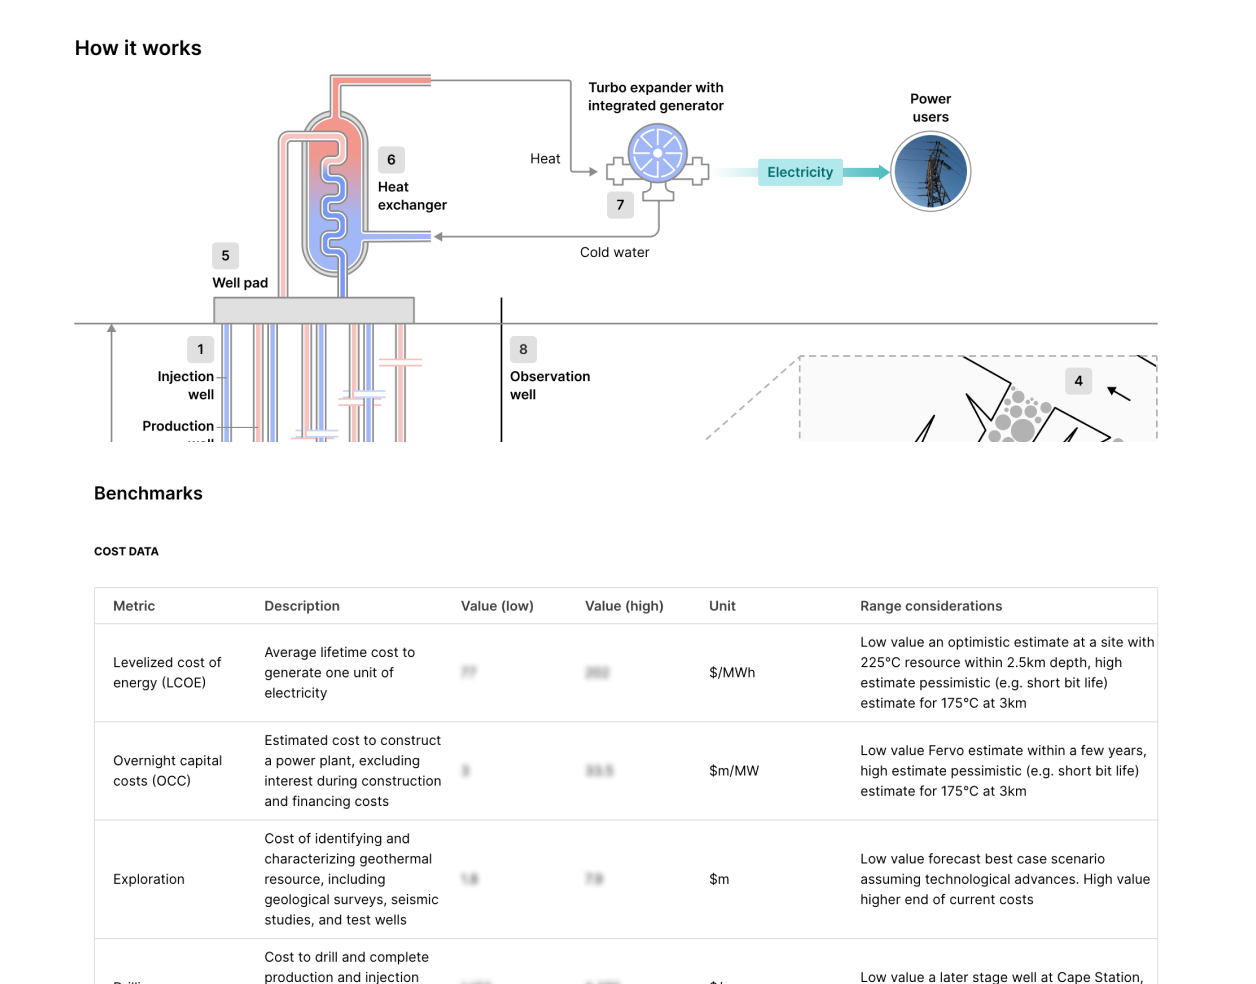
Pressure-test tech before you invest
Deep tech profiles combining proprietary Currence Readiness scores, cost and performance benchmarks, and technical assessments.
Validate which technologies are commercially competitive with proprietary readiness scores beyond TRL
Compare options side by side on cost, performance, and use cases to prioritize relevant technologies gaining traction
Benchmark vendor and target claims with independent data on deployment track record and economic viability
Diagram titled 'How it works' showing a geothermal energy system with labeled parts: injection well, production well, well pad, heat exchanger, turbo expander with integrated generator producing electricity for power users, and observation well. Below is a 'Benchmarks' table of cost data with columns for Metric, Description, Value (low), Value (high), Unit, and Range considerations, detailing costs related to Levelized cost of energy (LCOE), Overnight capital costs (OCC), and Exploration.
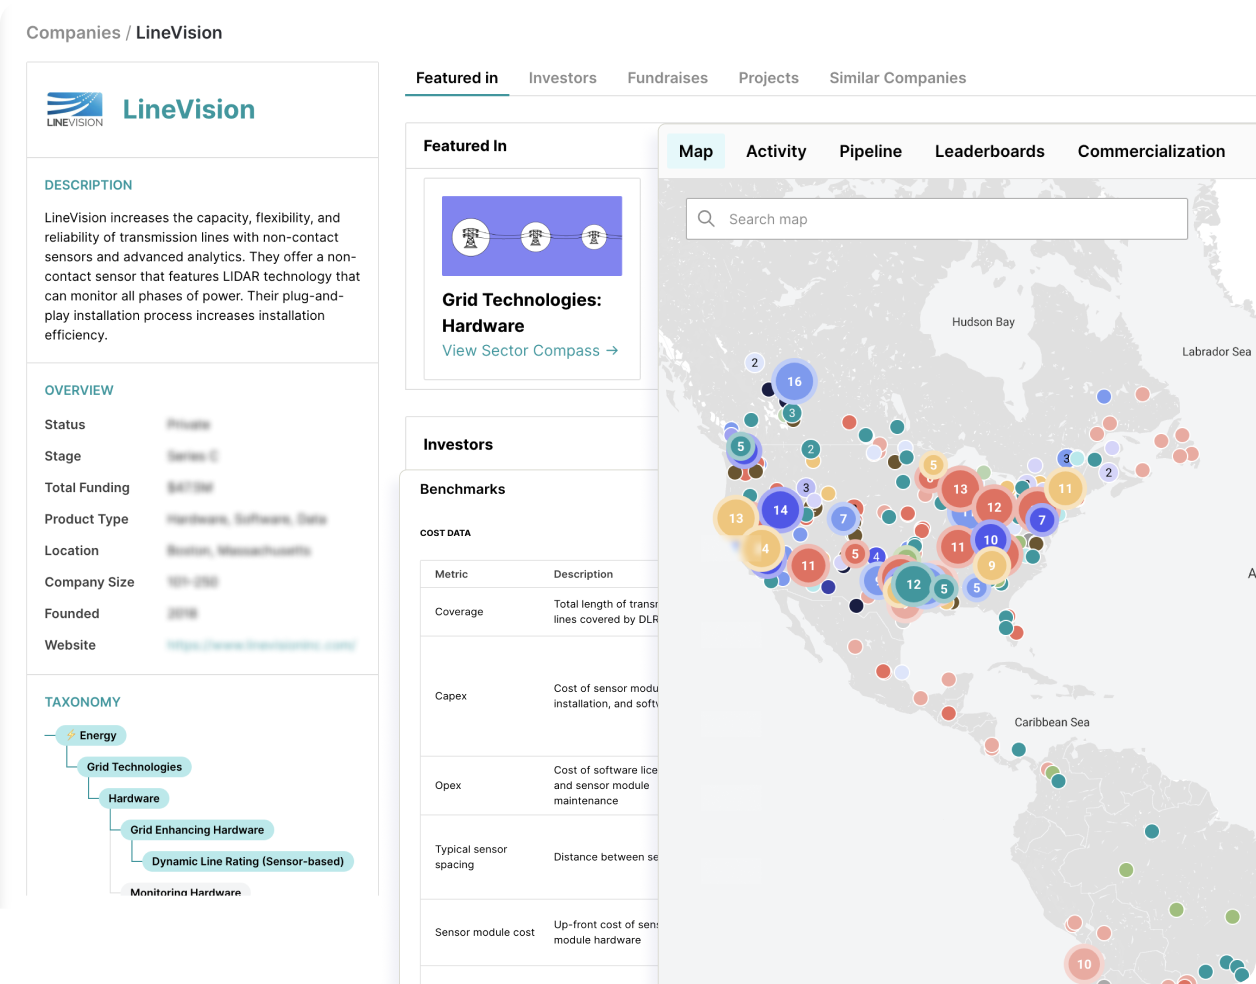
Shortlist the companies that can actually deliver
Track 60,000+ companies and the investors behind them, then rank the differentiated players with Currence Leaderboards.
Source companies across energy, robotics, and manufacturing, with profiles spanning funding history, commercial traction, and competitive positioning
Track investment and exits and the investors behind them to see where capital is flowing and which companies are scaling
Narrow to the leaders with Currence Leaderboards ranked on tech performance, cost, deployment track record, and economic viability so your procurement or investment decision holds up
User interface of LineVision company profile showing description, overview, and taxonomy on the left, with a map of North America on the right displaying clustered colored data points representing activity or projects. Tabs above the map include Map, Activity, Pipeline, Leaderboards, and Commercialization. The taxonomy highlights categories under Energy, Grid Technologies, Hardware, and related subcategories.
The "Holy Foak" Moment: How Sabanci Climate Ventures Met Fervo at a Currence Event
Sabanci Climate Ventures discovered Fervo Energy on stage during New York Climate Week 2024. They invested in the Series D. Fast forward two years: Fervo IPO’d at a $10 billion valuation.
Sabanci Climate Ventures
August 12, 2026
Read story
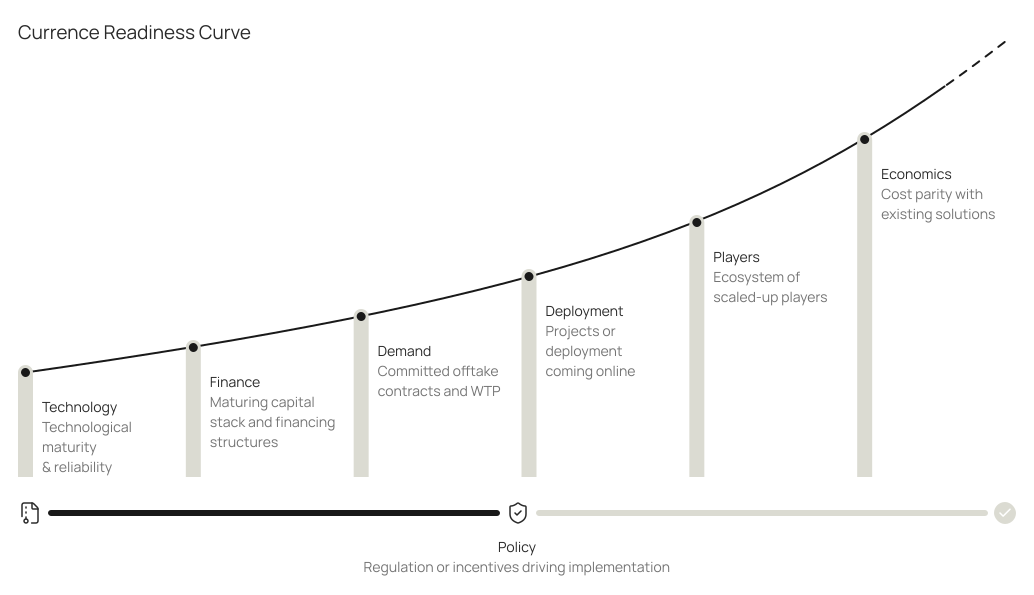
Identify what’s commercial ready with the Readiness Curve
Currence readiness curve
Underpinning Currence’s data, research, and models
The Currence Readiness Curve helps you evaluate the maturity and traction of emerging technologies across the energy transition, from technology readiness to economic competitiveness. Quickly identify the solutions that are ready to scale today, gaining momentum, or still playing catch up.